
Drawdown is one of the most important risk realities in trading. You cannot remove it completely, but you can measure it accurately, control its size, and recover from it with a structured plan instead of emotional reactions.
Every Trader Hits Drawdown
Every strategy with real market exposure experiences periods of losses. Even high-quality systems can go through rough patches due to variance, changing volatility, or temporary edge decay.
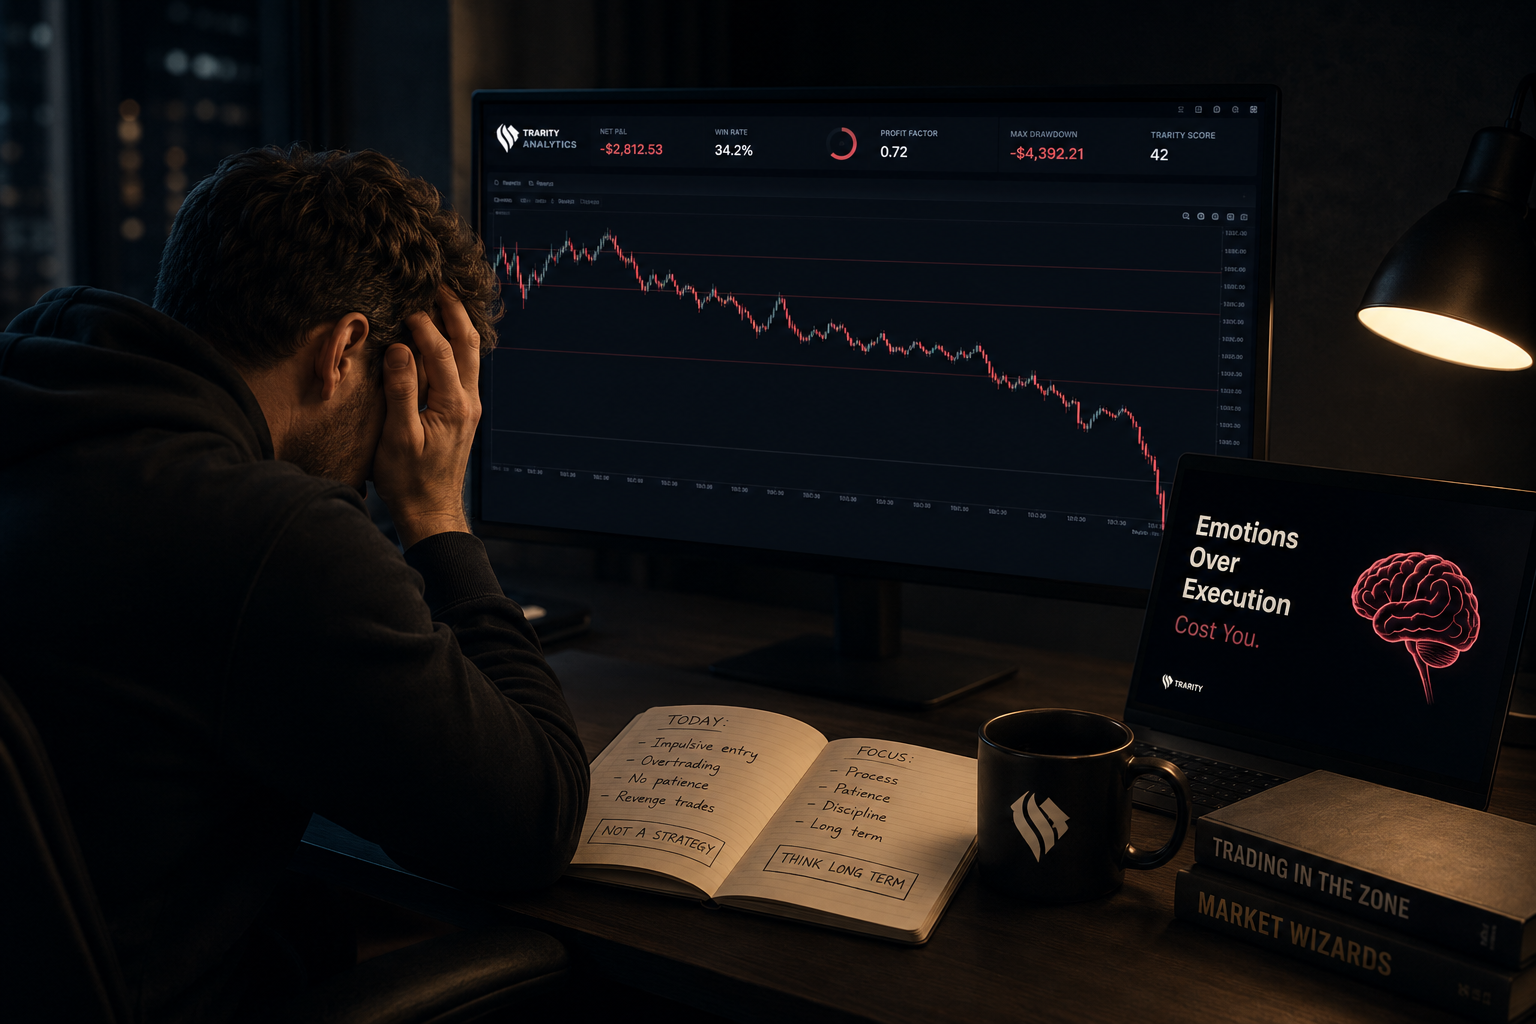
The difference between professionals and amateurs is not whether drawdown happens. It is how they respond when it does. Professionals reduce risk, review execution, and protect capital. Amateurs often increase size and hope to recover quickly.
If you treat drawdown as a normal operating condition instead of a personal failure, your decisions become calmer and more mechanical. That mindset shift alone can prevent many account-damaging reactions.
What Is Drawdown?
Drawdown is the decline from an equity peak to a subsequent trough. It tells you how far your account has fallen from its high watermark. Unlike daily P&L, drawdown captures cumulative damage over time.
There are three useful views: maximum drawdown (worst historical decline), current drawdown (where you are now vs latest peak), and average drawdown (typical pullback size across cycles). Looking at all three gives better context than any single number.
You can measure drawdown in dollars or percentages. Absolute drawdown in dollars helps with cash impact, while relative drawdown in percentages helps compare performance across account sizes.
Formula: Drawdown % = (Peak Equity - Trough Equity) / Peak Equity. Worked example: if equity drops from $50,000 to $42,500, drawdown is (50,000 - 42,500) / 50,000 = 15%.
What Causes Extended Drawdowns
Extended drawdowns often start with strategy drift. Traders slowly deviate from setup rules, enter lower-quality trades, and convince themselves they are still following plan. Small deviations accumulate into measurable equity damage.
Another frequent cause is overtrading after losses. When traders try to recover quickly, they increase trade frequency and reduce setup selectivity. This multiplies exposure exactly when judgment is weakest.
Increasing position size to recover losses is especially dangerous. It can feel rational in the moment, but it raises account risk during a period where performance is already unstable.
Regime change also matters. A strategy that performs in trend conditions may underperform in chop, and vice versa. If your edge does not fit current conditions, drawdown can persist until either market regime shifts or your playbook adapts.
How Much Drawdown Is Too Much?
A practical rule: if maximum drawdown exceeds two times your expected monthly return, treat it as an investigation trigger. This threshold does not mean automatic failure, but it signals a likely issue in risk, execution, or edge fit.
For prop firm traders, thresholds are often stricter. Many programs enforce around 5-10% daily drawdown and 10-12% total drawdown limits. Breaching these can end an evaluation instantly, regardless of long-term potential.
There is also a psychological threshold. Even if your model allows deeper drawdowns, the level where you start trading emotionally is effectively too deep for your current process. Risk limits must match both math and behavior.
The Drawdown Recovery Framework
Recovery begins with interruption, not action. Step one is to stop trading for 24 hours and break the emotional momentum. Continuing immediately after sharp losses often increases damage.
Step two is a focused review of your last 10 to 20 trades with labels: setup type, mistake type, and emotional state. This shows whether the issue is strategy fit, execution drift, or risk behavior.
Step three is to reduce size by 50% for the next phase. Smaller size preserves confidence and keeps mistakes affordable while you rebuild process consistency.
Step four is to activate recovery-mode daily limits, tighter than normal. Step five is to return to full size only after five compliant green days, not after one lucky session.
Drawdown Math
Drawdown recovery is nonlinear. The deeper the loss, the disproportionately larger the return required to get back to breakeven. This is why preventing large drawdowns matters more than chasing outsized wins.
A quick reference:
| Drawdown | Gain Needed to Recover |
|---|---|
| -10% | +11.1% |
| -20% | +25% |
| -50% | +100% |
Small differences in risk discipline have massive long-term impact because they keep you out of deep recovery math. Preserving capital is the foundation that allows compounding to work.
Track drawdown in real time
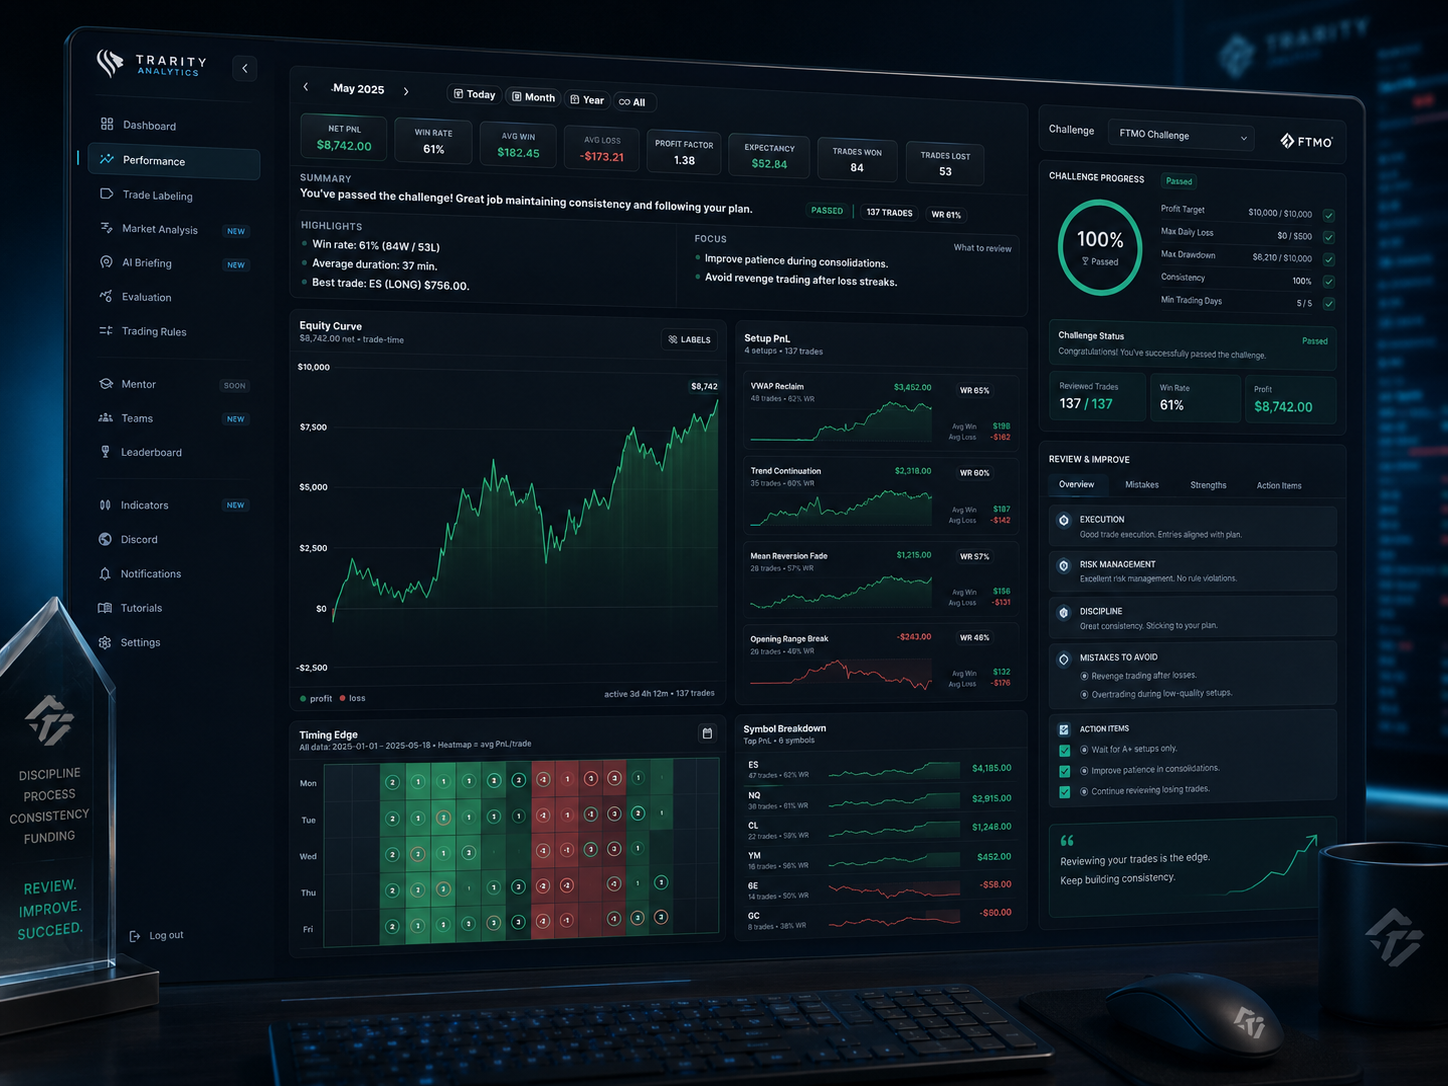
Trarity calculates max drawdown, current drawdown, and recovery progress automatically from your imported trades. Free for 30 days.
Start for free arrow_forwardFrequently Asked Questions
It depends on strategy and risk model, but many disciplined day traders keep drawdown in low single digits most of the time and treat moves toward 10% as a serious warning. Normal should always be defined in your written risk plan.
Find the largest peak-to-trough decline in your equity curve and divide by peak equity. If your account drops from 50,000 to 40,000, max drawdown is 20%.
A short stop is often useful when drawdown accelerates or discipline slips. Pausing for 24 hours to review recent trades can prevent emotional overtrading and improve recovery quality.
Most prop firms track strict daily and total drawdown limits, often around 5-10% daily and 10-12% total depending on the program. Violating these thresholds can fail the account immediately.
A 20% drawdown needs a 25% gain to recover. The timeline varies, but disciplined recovery with reduced size and strict process usually outperforms aggressive attempts to recover quickly.
This article was created with the help of AI and reviewed and edited by the Trarity team.