Trading Analytics Software That Shows Where Your Edge Is
Track your trading metrics with a performance dashboard built for serious traders. See your win rate, profit factor, expectancy, drawdown, and risk reward ratio — all in one place. Trading performance analytics that turn raw trading data into decisions.
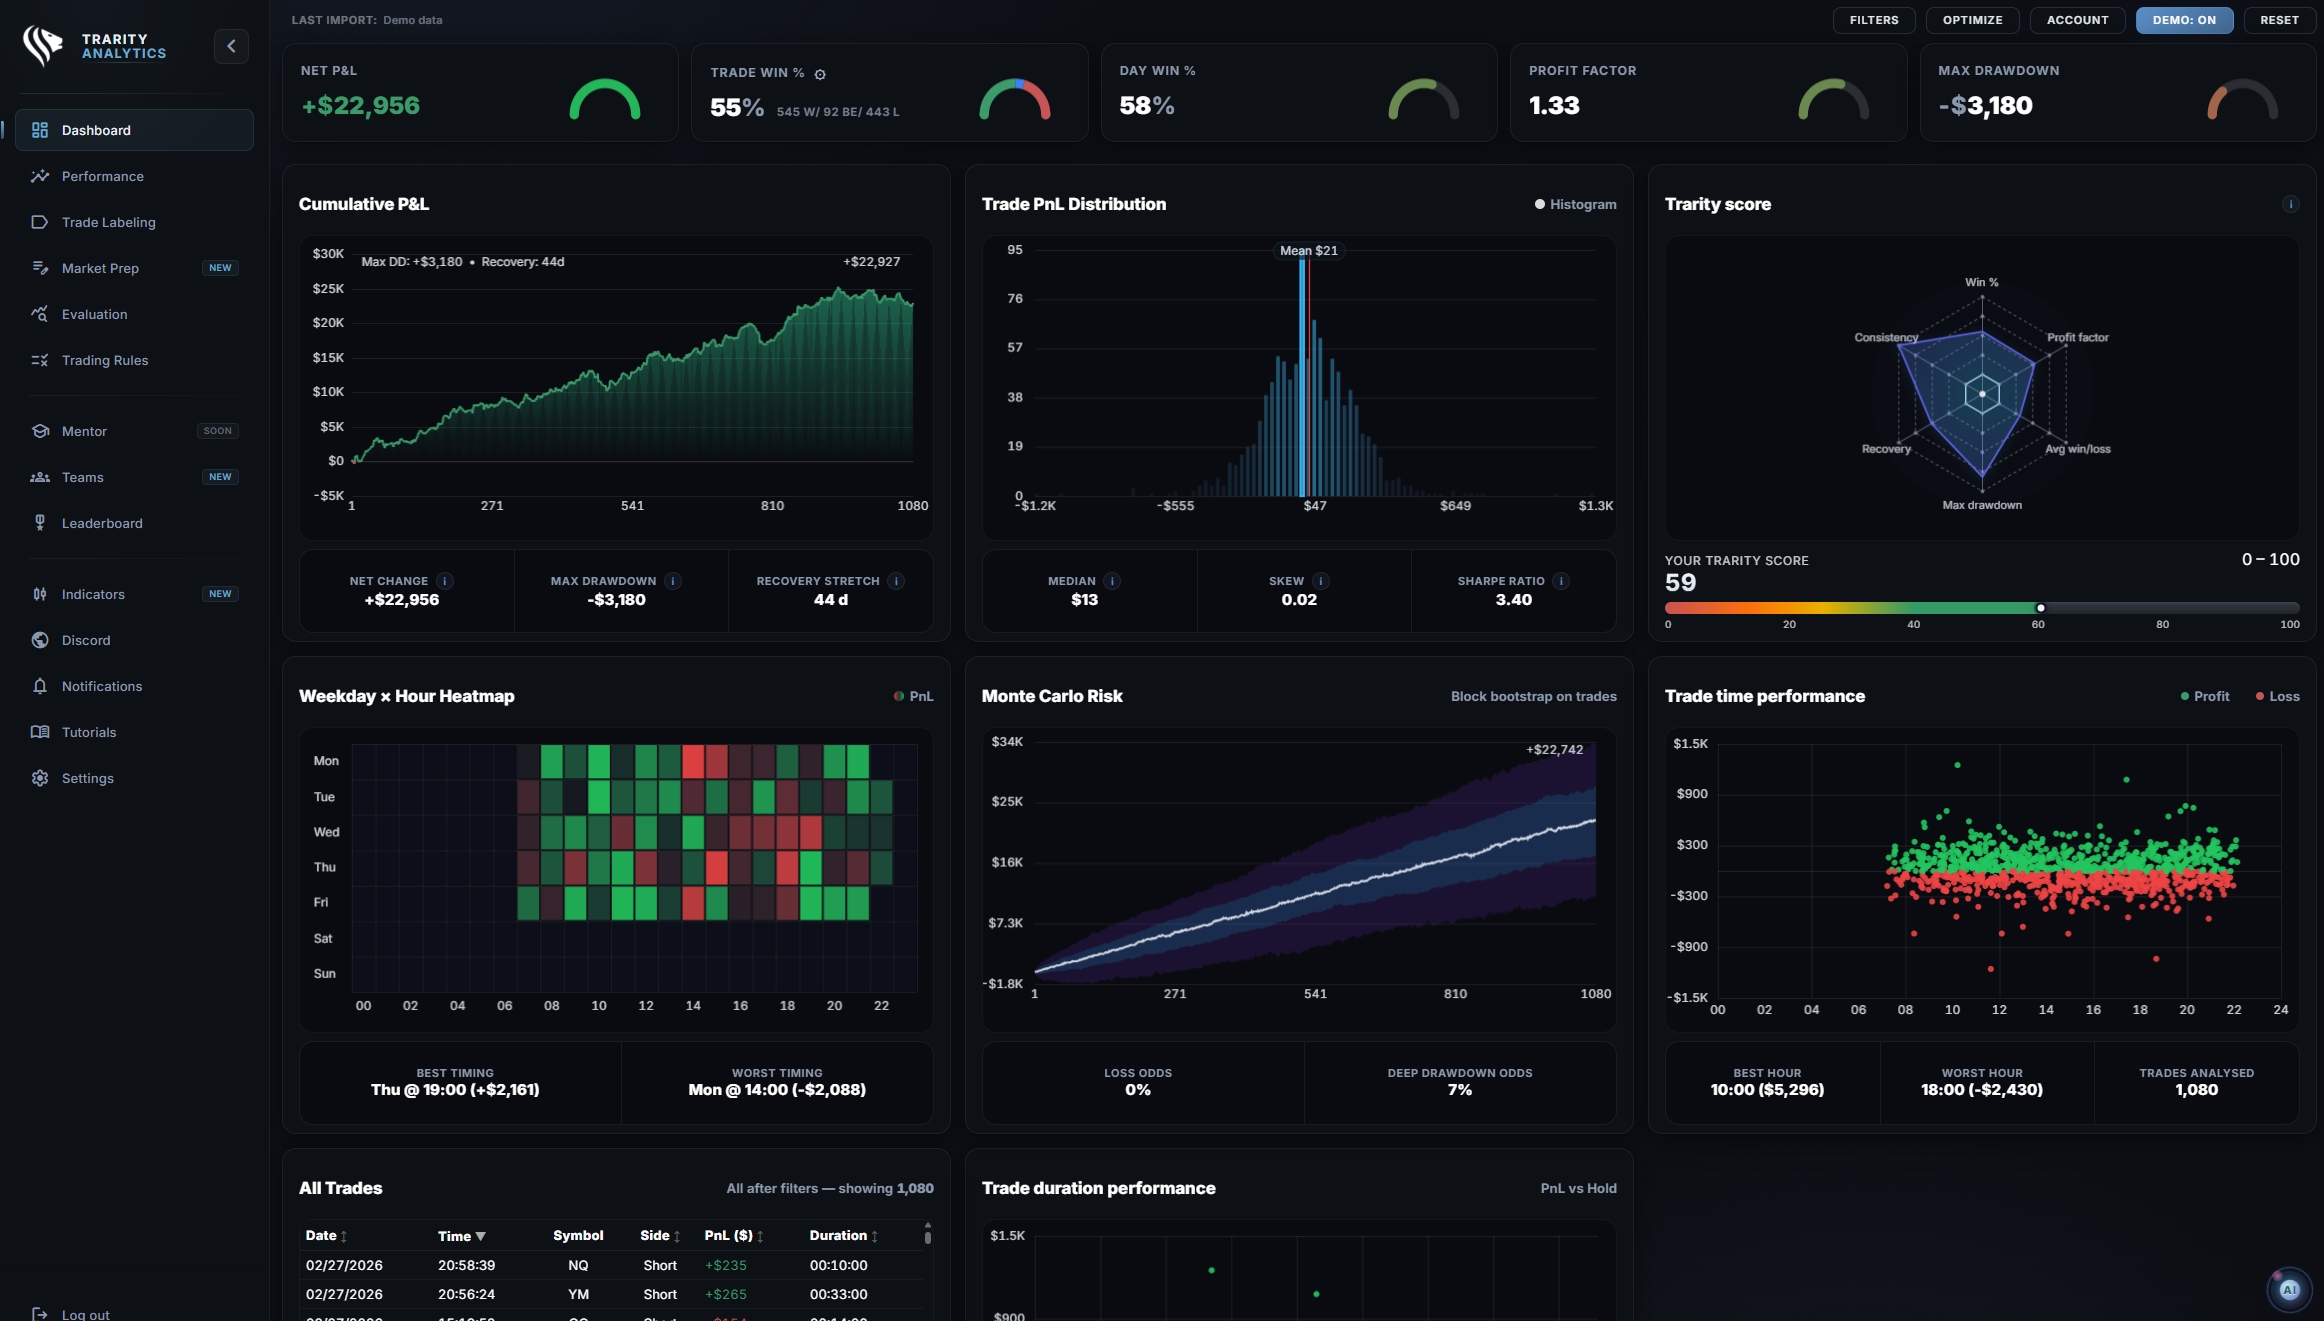
See Your Trading Performance Clearly
Your trading performance dashboard calculates every metric automatically from your imported trades. Win rate, profit factor, expectancy, drawdown — see it all at a glance. Filter by date, instrument, setup type, session, or market regime.
- check_circleWin rate & profit factor tracking
- check_circleExpectancy calculated per setup
- check_circleAverage winner & average loser breakdown
- check_circleDrawdown & max drawdown monitoring
- check_circleEquity curve with regime overlay
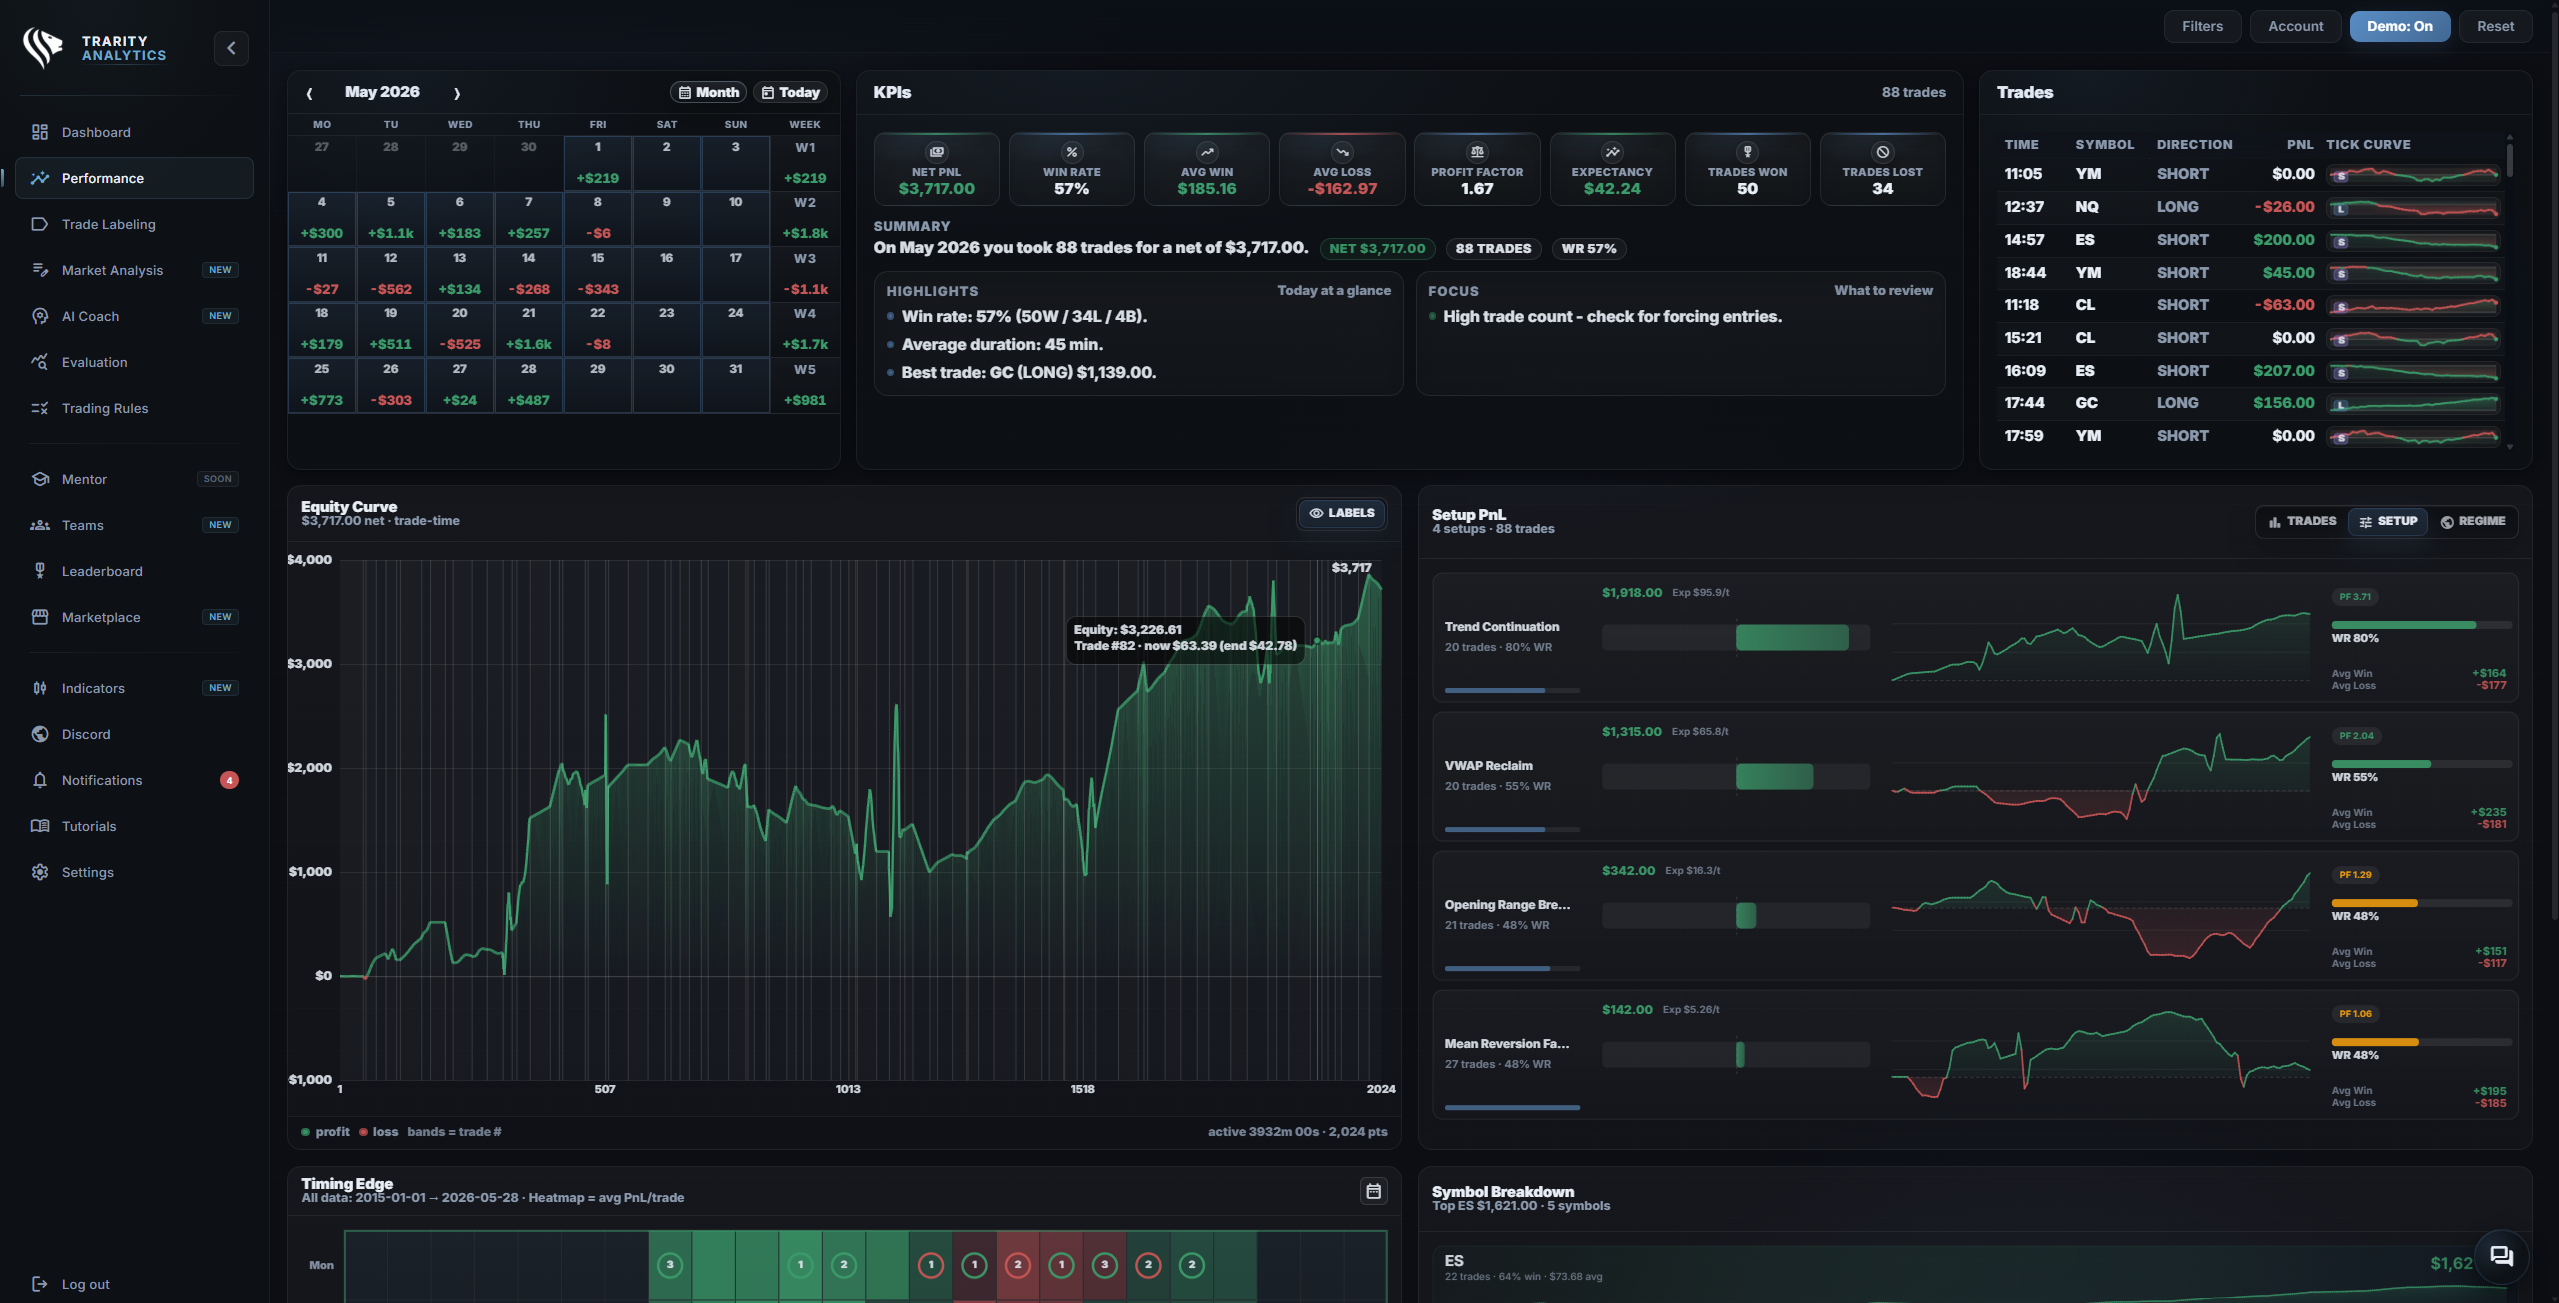
Track the Metrics That Actually Matter
Go beyond surface-level stats. Your trading metrics dashboard tracks risk reward ratio, expectancy, profit factor, and more — broken down by setup, session, and regime. See exactly which conditions produce your best results.
- check_circleRisk reward ratio per setup
- check_circleProfit factor by time of day
- check_circleExpectancy across market regimes
- check_circlePeriod-over-period comparison
- check_circleCustom metric filters
Find Your Best and Worst Setups
Setup performance analysis shows exactly which trades are making you money and which are draining your account. Compare average winner vs average loser, win rate, and profit factor for every setup in your playbook.
- check_circleWin rate & profit factor per setup
- check_circleAverage winner vs average loser comparison
- check_circleSetup-level equity curves
- check_circleRobustness scoring per setup
- check_circleRegime & time-of-day cross-analysis
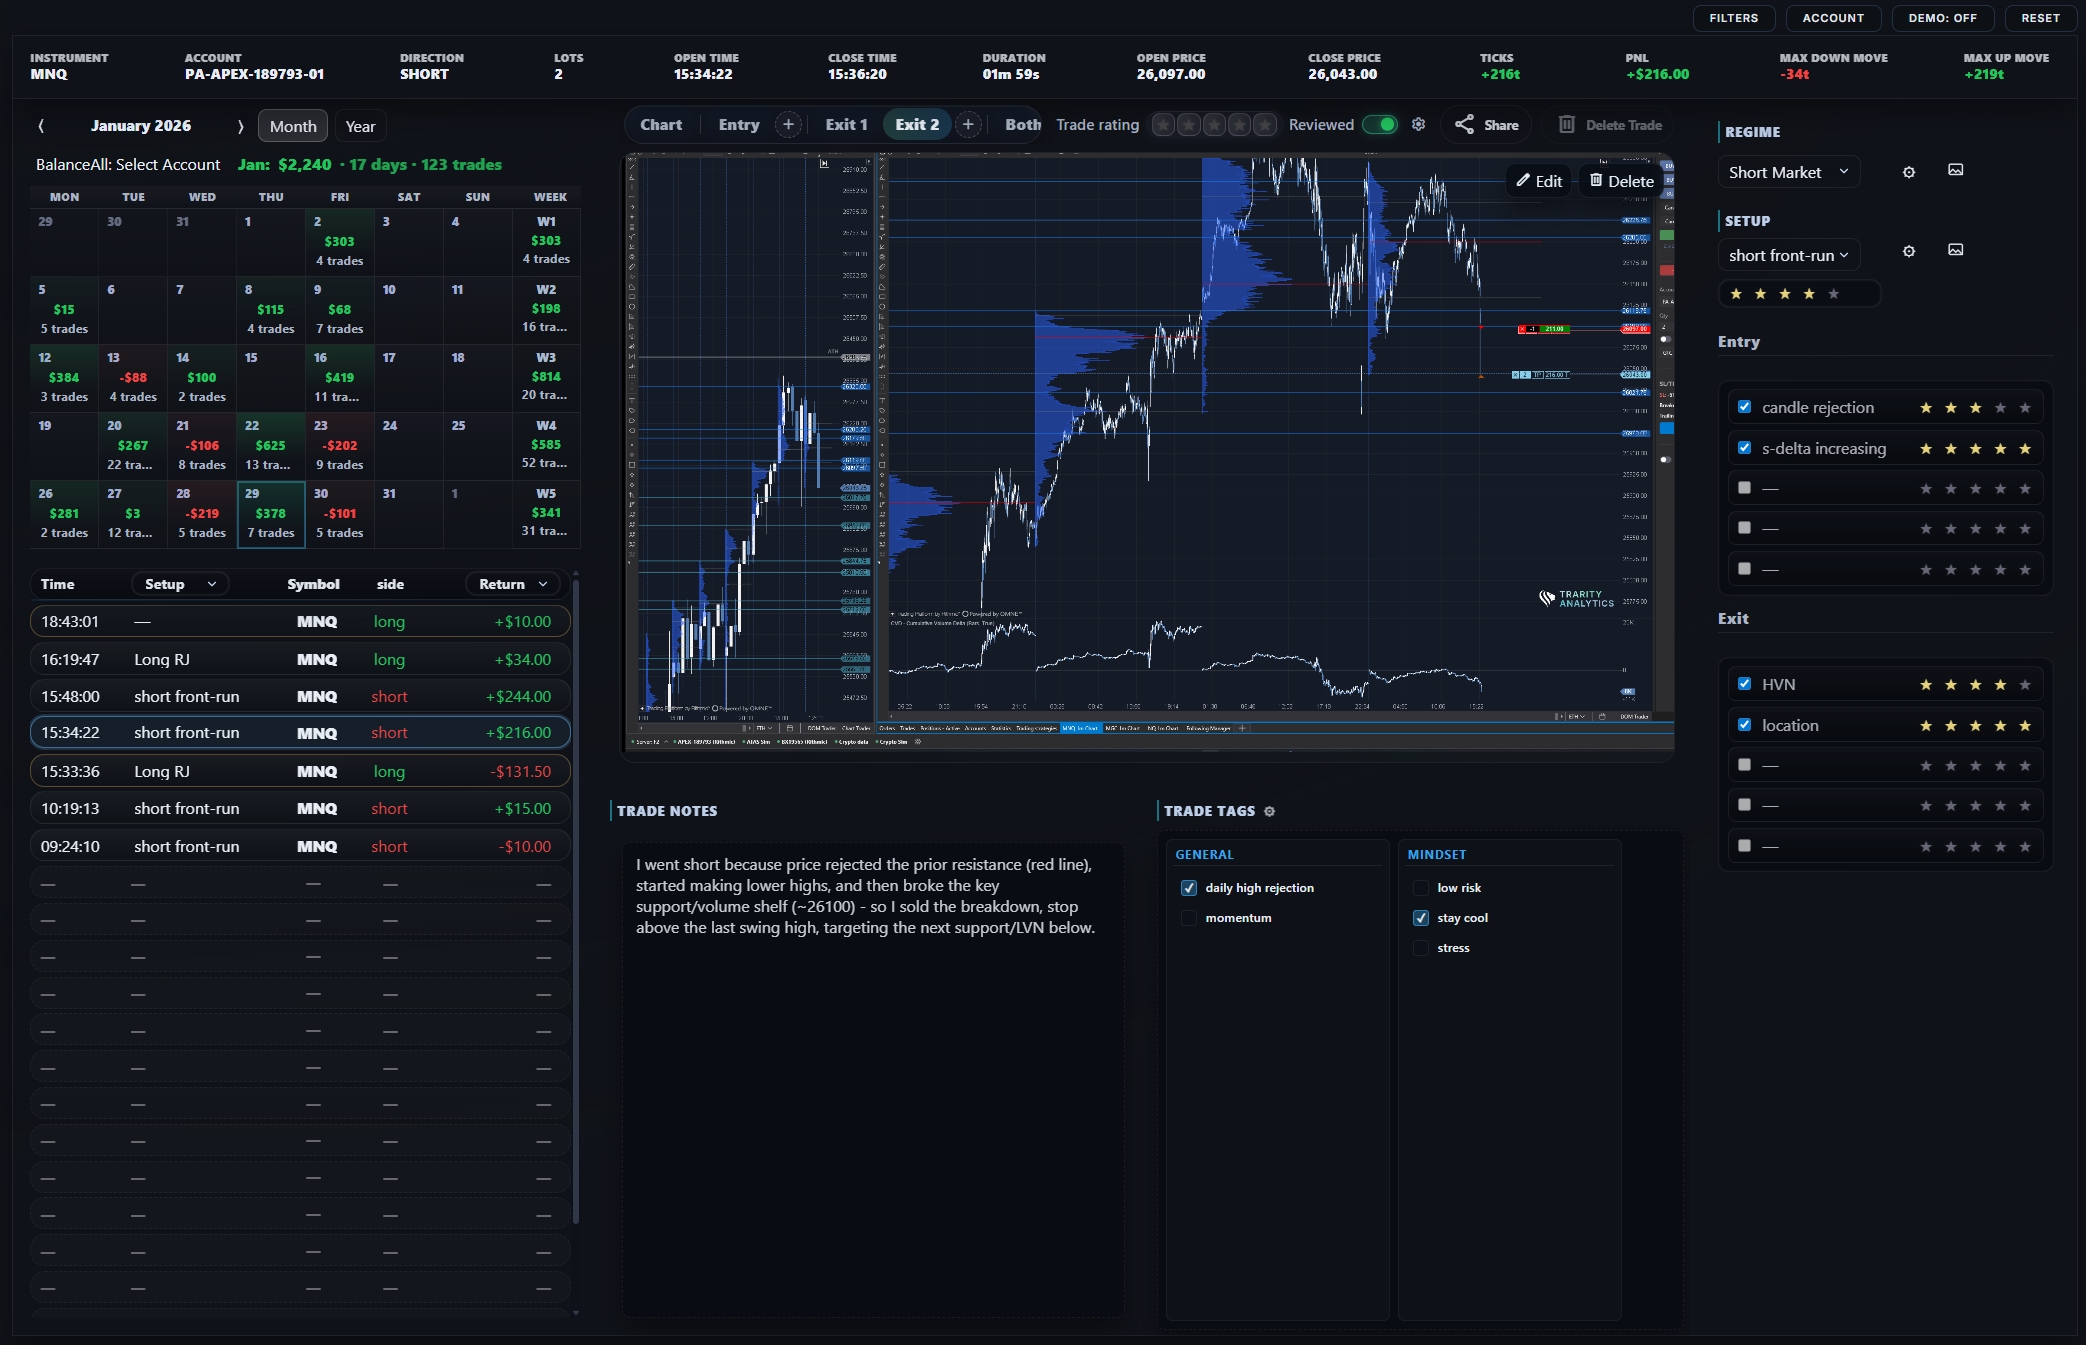
Analyse Mistakes by Tag and Category
Spot your mistake patterns before they compound. Tag errors by category — early entries, missed exits, oversizing — then run execution analysis to see which mistakes cost you the most. Turn awareness into discipline.
- check_circleTag-based mistake tracking
- check_circleMistake frequency & cost analysis
- check_circleExecution analysis per mistake type
- check_circleProcess drift detection
- check_circleAI-powered mistake pattern recognition
Discover Where Your Edge Comes From
Edge discovery goes beyond basic stats. Time-of-day heatmaps, regime analysis, and robustness scoring reveal whether your edge is real or noise. Trader performance analytics that show exactly when and how you trade best.
- check_circleTime-of-day performance heatmaps
- check_circleRegime-based edge breakdown
- check_circleSetup vs. condition cross-analysis
- check_circleRobustness scoring
- check_circlePattern-focused filtering
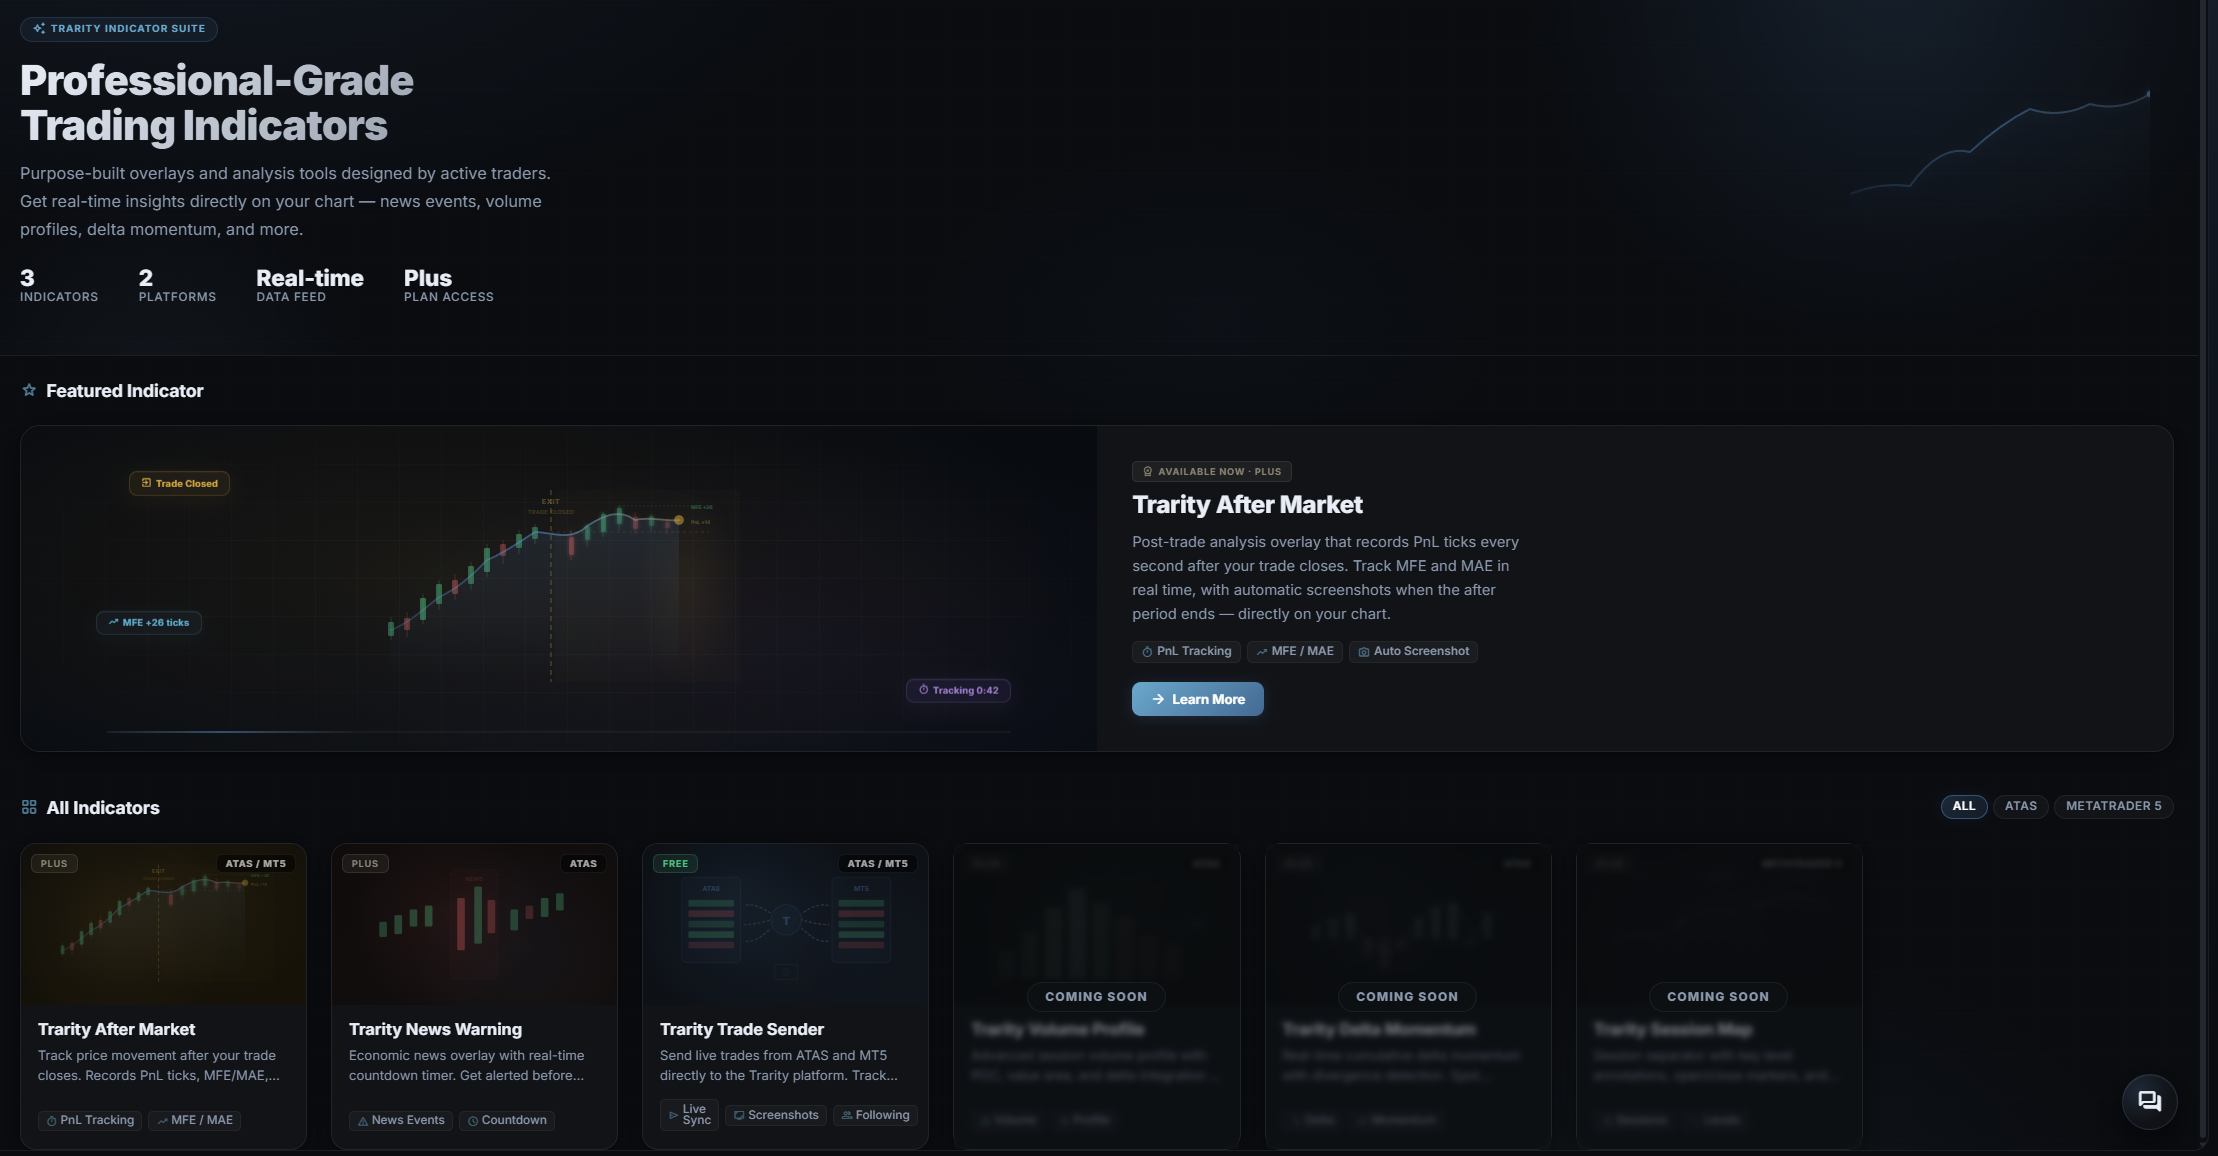
Turn Raw Trade Data into Decisions
Import your trading data from any supported platform and watch it transform into actionable analytics. Trade analytics software that connects to your broker, organizes your history, and gives you the insights you need to improve.
- check_circleAuto-import from 5+ platforms
- check_circleCSV & manual trade entry
- check_circleCustom labels & categories
- check_circleExportable reports
- check_circleShareable performance snapshots
Frequently Asked Questions
Start Discovering Your Trading Edge
Full access for 30 days. No credit card required. Connect your platform and see your analytics in minutes.